Chrome-DevTools MCP: A Connection Quirk Worth Knowing
Overview
While testing out Google's Chrome-DevTools MCP (Model Context Protocol), I discovered an interesting quirk when connecting to an existing Chrome instance. Here's a quick note on what I found.
Setup Requirements
To connect the Chrome-DevTools MCP to an existing Chrome instance, you need to configure two components:
1. MCP Configuration
Add the --browserUrl parameter pointing to the remote debugging port:
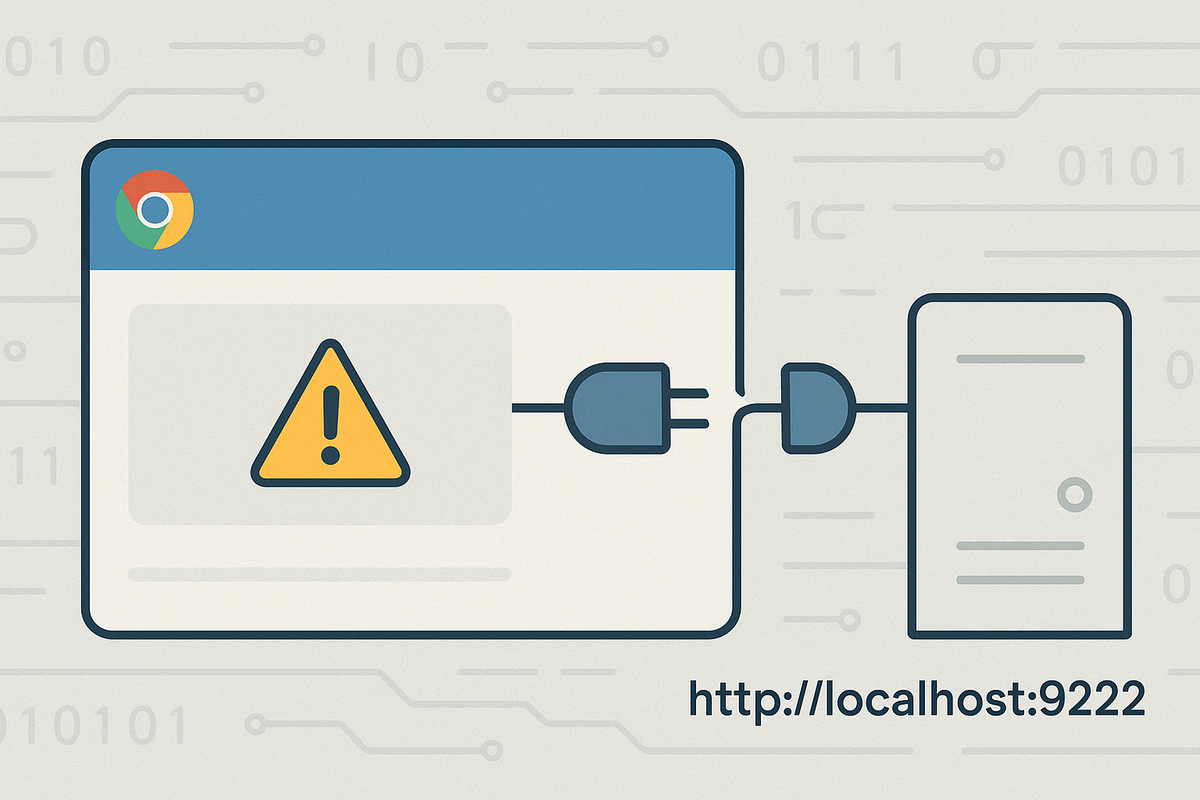
--browserUrl http://localhost:9222
2. Chrome Launch Parameters
Launch Chrome with the following parameters:
chrome --remote-debugging-port=9222 --user-data-dir=/path/to/custom/profile
Important Notes:
- The
--remote-debugging-port=9222parameter is required to enable remote debugging - You must specify a custom
--user-data-dir- Chrome won't allow remote debugging with the default data directory - Port 9222 is the standard remote debugging port, but you can use any available port
The Problem
After launching Chrome with these parameters, I encountered a frustrating issue:
- The MCP couldn't retrieve any data from Chrome
- All requests would hang indefinitely with no response
- Using the MCP Inspector tool showed request timeout errors
- The
list_pagestool and other Chrome-DevTools MCP functions were completely unresponsive
Interestingly, Chrome's remote debugging endpoints were actually responding properly:
curl http://127.0.0.1:9222/json
curl http://127.0.0.1:9222/json/version
Both commands returned valid responses, confirming that:
- The remote debugging port was active and accessible
- Chrome's HTTP endpoints were functioning normally
- The basic connection infrastructure was working
Yet despite this, the chrome-devtools-mcp tools continued to timeout. This ruled out simple connection issues and pointed to something more specific about the MCP's interaction with Chrome.
The Solution
The fix turned out to be surprisingly simple:
Manually open a webpage in the Chrome instance (e.g., navigate to google.com or any other site)
Once a page was loaded:
- The MCP Inspector immediately started receiving responses
- The
list_pagestool returned results successfully - All Chrome-DevTools MCP tools became fully functional
- Both Claude and Claude Code could interact with Chrome normally
Why This Happens
The most likely explanation is that Chrome's remote debugging protocol requires at least one active page/tab context to properly initialize the debugging connection. When Chrome launches with only remote debugging enabled but no pages open, the debugging endpoint may not be fully ready to accept and process MCP requests.
Opening any webpage forces Chrome to:
- Initialize the page context
- Fully activate the debugging protocol handlers
- Make the debugging interface properly available to external connections
Best Practice
Based on my experience, here's the workflow that works reliably:
- Open at least one webpage in the Chrome instance (e.g., navigate to
google.com) - Call the MCP tools from your MCP client (Claude, Claude Code, or MCP Inspector)
Configure and start your MCP client with:
--browserUrl http://localhost:9222
Launch Chrome with required parameters:
chrome --remote-debugging-port=9222 --user-data-dir=/path/to/custom/profile
This sequence ensures the debugging connection is fully initialized before your MCP client attempts to interact with Chrome.
Conclusion
This small but crucial step - ensuring at least one page is open - can save significant debugging time when working with Chrome-DevTools MCP. It's an easy detail to miss in the documentation, but essential for establishing a stable connection.